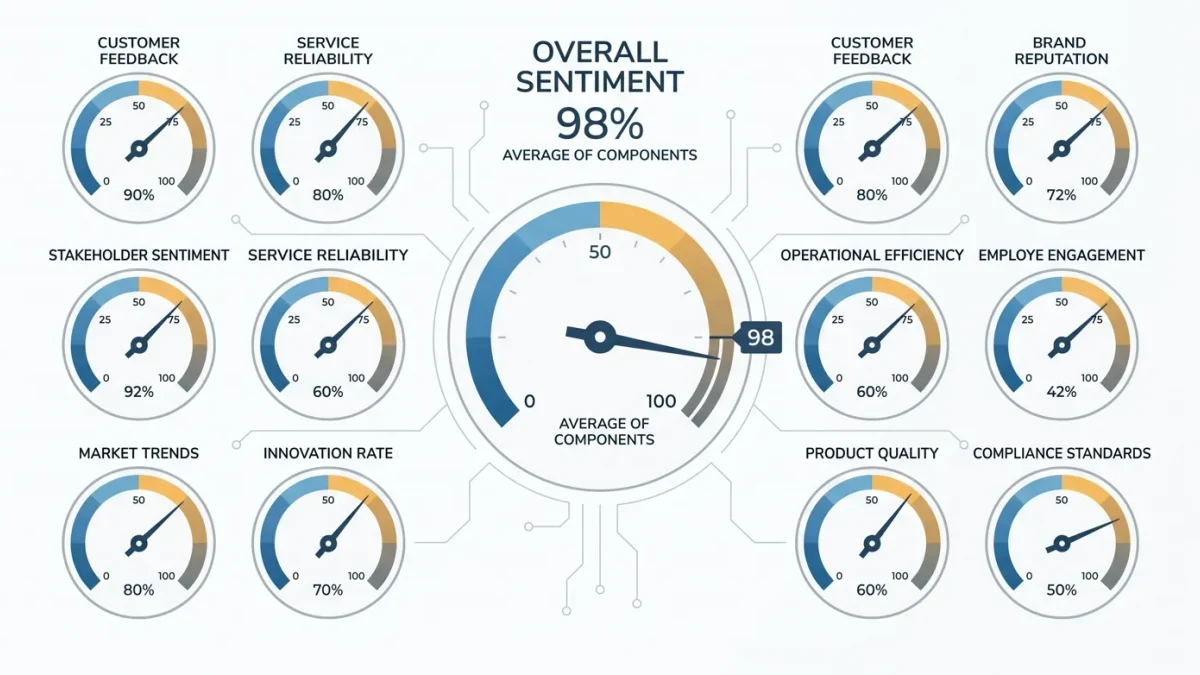
The crypto Fear and Greed Index is a daily score from 0 to 100 that compresses market sentiment into a single dial: 0 means extreme fear, 100 means extreme greed. The widely-quoted version, computed by the crypto data platform alternative.me, blends six weighted inputs — volatility, market momentum and volume, social media volume, bitcoin dominance, Google Trends data and investor surveys — into one number that swings from single digits in capitulations to the high eighties in manias.
Bitcoin Trader publishes information, not investment advice. Sentiment gauges are not trading signals; crypto markets are volatile and losses are possible.
What goes into the number?
Six components with fixed published weights. Volatility, at 25 percent, compares current bitcoin volatility against the trailing monthly average. Momentum and volume, also 25 percent, measure current buying volume and market momentum against norms. Social media, 15 percent in the standard methodology, counts post volume and interaction rates on major platforms. Bitcoin dominance contributes 10 percent, on the reasoning that rising dominance reflects fear-driven retreat into bitcoin from altcoins. Google Trends contributes 10 percent, weighted by search volumes for bitcoin-related queries. Investor surveys — the component most sensitive to participation cycles — carry 15 percent.
The construction explains the behavior: because most inputs are momentum-adjacent, the index leans toward higher readings while prices rise and lower readings while they fall. It is, structurally, a smoothed derivative of recent price action plus attention — which makes it a description of mood, not an independent measurement of it.
How has the index behaved in real cycles?
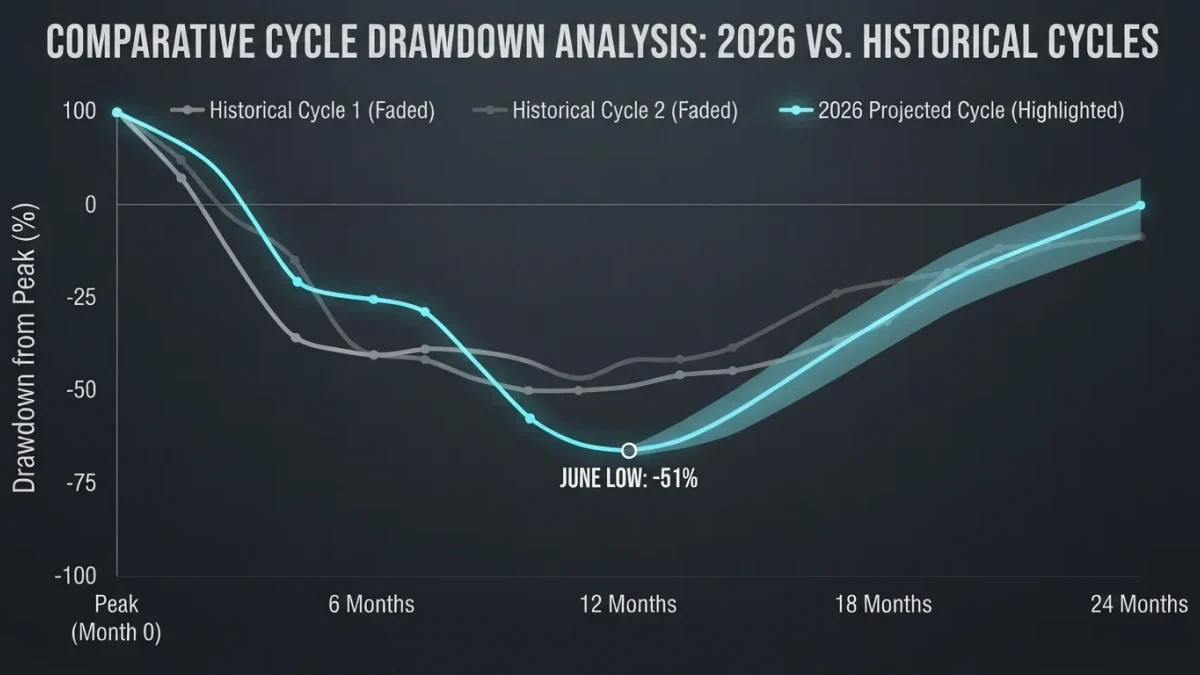
Like a mood ring with good data. Historical readings have hit extreme fear in capitulations — deep single digits and low teens during the worst drawdowns of past cycles — and extreme greed above 85 during mania phases. The 2025-2026 period produced both regimes: greed-tier readings during the strong trend into early 2025, and fear-dominant readings through the January 2026 slide toward multi-month lows, when the gauge spent weeks in fear territory while prices fell.
The honest backtest question is whether extremes predict reversals, and the answer is: not on a schedule. Markets have stayed at greed extremes for months while trends continued, and fear readings have arrived long before prices bottomed. Extremes mark regimes; they do not time them.
Why do people watch it if it lags price?
Three legitimate uses. As a summary statistic: one number that tells a reader which regime the market's attention is in, faster than reading five dashboards. As a discipline device: a written plan that scales exposure by sentiment is at least a plan, and some systematic traders use sentiment extremes as one input among many for mean-reversion or momentum rules — tested with the same rigor as any other factor. As a media barometer: headlines quoting the index are themselves evidence about narrative saturation, which is occasionally the most informative reading of all.
The illegitimate use is as a contrarian oracle — the reflex that says extreme fear means buy. That rule has worked and failed across cycles in roughly the proportion you would expect from a lagging average of price: it keeps you early in crashes and late in recoveries.
What are the index's blind spots?
Construction, weighting and gaming. The survey component samples a self-selected population — platform users inclined to click polls — so it measures the mood of participants, not of capital. Social and trends inputs are denominated in attention, which is cheap to manufacture: coordinated posting and bot activity move the social component without moving any market. Dominance's interpretation breaks in regimes where altcoin flows move for structural reasons — ETF launches, unlocks — rather than sentiment. And the fixed weights were chosen by the constructor, not estimated from data, so the index is an editorial artifact with arithmetic inside.
Regulators' investor-education materials on crypto — the SEC's among them — make the adjacent point from the other side: sentiment-driven buying, fear of missing out, and decisions keyed to crowd mood are the recurring ingredients of retail losses. An index that quantifies the crowd is a mirror, not a map.
How should a reader use it responsibly?
As context in a sentence, with a date: sentiment was extreme fear as of a given day, alongside price, funding and open interest — each describing the same market through a different lens. When the lenses disagree — price falling while greed persists, or price recovering while fear does — the disagreement is the information, marking a transition the single dial cannot.
The index earns its place on a dashboard the way a weather vane does: it tells you which way the wind is blowing right now. It has never claimed to tell you when the wind will change, and a decade of readings is kind enough to keep proving it.
What other sentiment gauges do desks watch alongside it?
The Fear and Greed Index is the most quoted sentiment number, but it is one dial on a panel. Funding rates read the leveraged crowd's direction and conviction — the rate is literally the price the crowded side pays to stay in the trade. Options gauges follow from listed derivatives: implied volatility and the skew between puts and calls express how expensive traders find downside protection relative to upside exposure, the crypto analog of equity fear measures. The stablecoin supply ratio compares stablecoin market value to the rest of the market — a dry-powder measure, since stablecoins are the marginal buying fuel parked at exchanges. And bitcoin dominance functions as a risk-appetite dial within crypto, as the index's own construction acknowledges by including it.
The discipline that makes the panel useful is disagreement analysis. When every gauge aligns — fear-tier funding, rich put skew, a high stablecoin ratio, rising dominance — the market's mood is legible in each instrument and the information lives at the extremes. When gauges conflict — the index in fear while funding stays greed-positive, price recovering while sentiment does not — the conflict marks a transition the single dial averages away. A panel read together, with dates, beats any one dial read alone; the same is true of the market data the sentiment is derived from.
Can the index be used in systematic strategies?
Only with the rigor any factor demands. Sentiment-extreme rules — reducing exposure at greed readings, adding at fear — are testable against the published daily history, and honest backtests show regime-dependence rather than a universal edge: rules that bought extreme fear worked in V-shaped cycles and held losers through extended winters. Strategies using the index as one input among several — alongside trend, volatility and liquidity conditions — show more stable behavior than rules keyed to the dial alone, which is the general finding of factor research everywhere: single sentiment measures are noisy; ensembles carry the information.