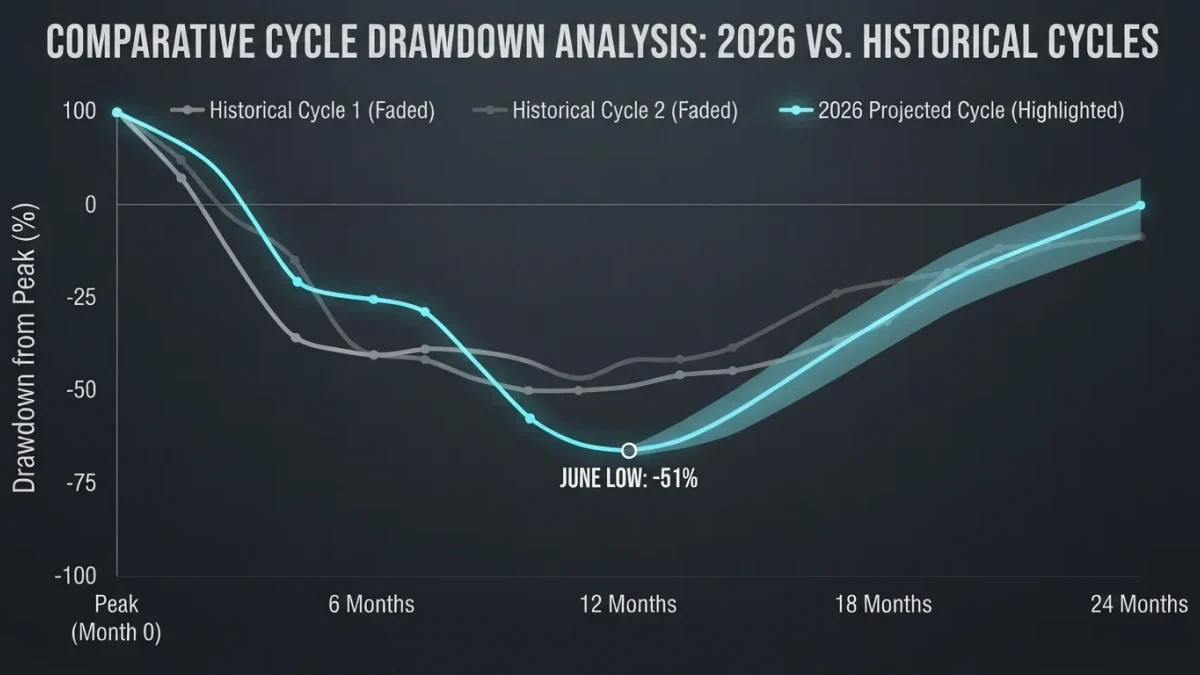
Bitcoin's June drawdown has erased the market's May recovery: after rallying on a Sunday in early June, the price slid 8.3 percent the following day and has held below its late-May levels since, per CoinDesk market reporting of June 8. The decline extends a path the market can already read from disclosed corporate purchase prices — Strategy's April tranche averaged 74,395 dollars, its May 18 tranche 80,985 dollars — marking a recovery the first weeks of June have now fully retraced.
Bitcoin Trader publishes information, not investment advice. Drawdowns are normal market behavior; nothing here predicts their extent or end.
What has the month shown so far?
A failed rally and a persistent bid vacuum. The early-June Sunday rally described by CoinDesk briefly lifted sentiment; Monday's 8.3 percent single-day slip gave it back, and the report's own framing — that a full-fledged reversal may take longer — has so far read as prescient rather than cautious. Funding markets tell the positioning story: rates that had recovered with May's price turned negative again as the slide pushed leveraged longs out, the same regime shift that marked January's leg down.
The reference points for how far the market has traveled sit in public disclosures. Strategy's May 18 purchase at an average near 80,985 dollars marked the recovery's top zone; its April 20 tranche at 74,395 dollars marked the spring's base. June has traded below the spring base — meaning both the recovery and more have been surrendered, without, as of this writing, the washout capitulation prints that ended prior drawdowns.
Why is this drawdown different from January's?
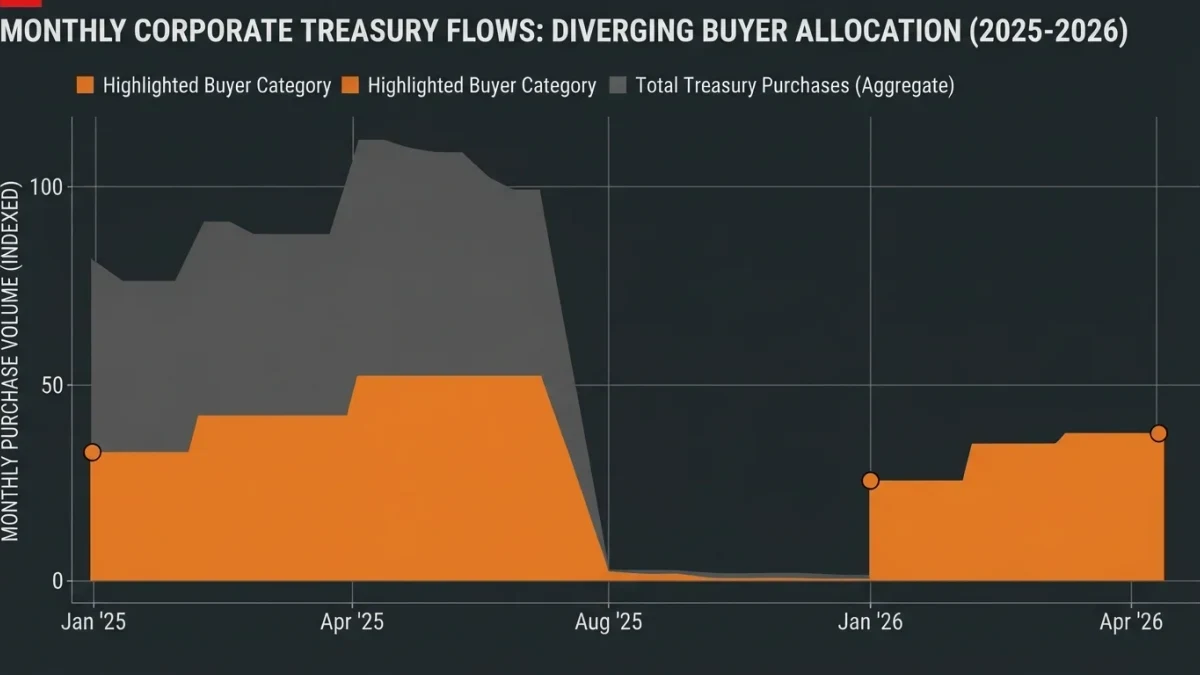
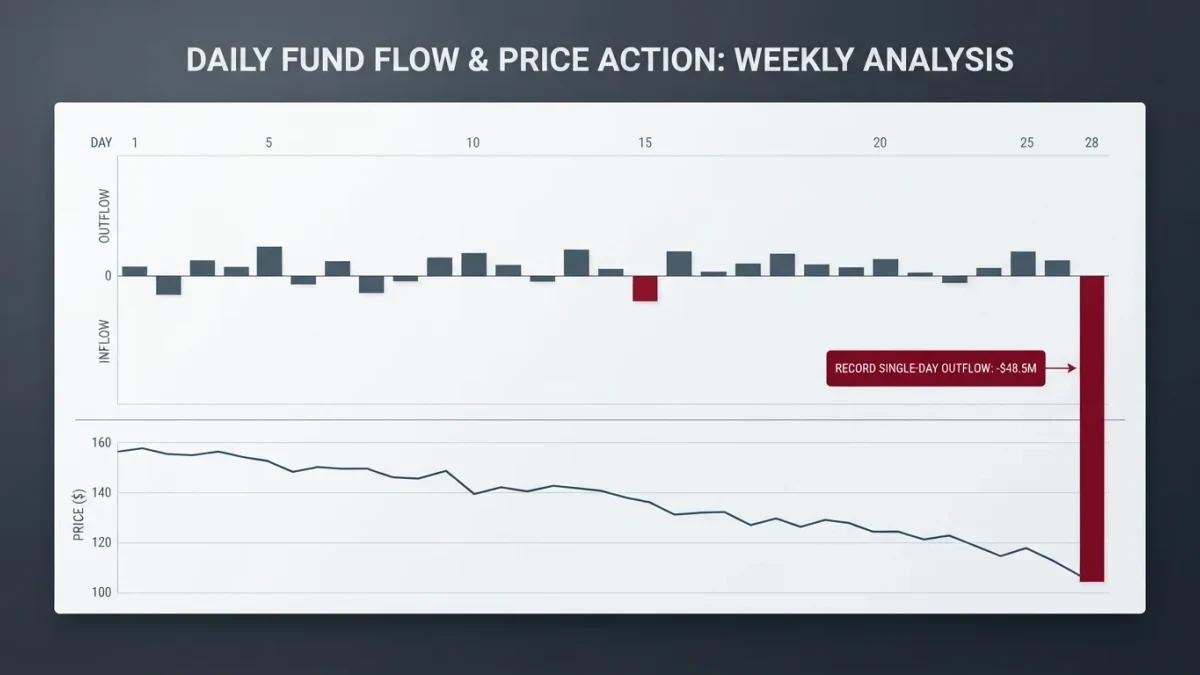
Structure, not speed. January's slide was a fast repricing — weeks from 91,000 dollars to ten-month lows — accompanied by a record ETF redemption. June's has been slower and cleaner: leverage unwinding over days rather than a single gap, with funding flipping negative early and staying there. The two channels of institutional flow also sit differently: the January record IBIT outflow was panic after a low; through June, the corporate channel has continued its cadence while the ETF channel bled without record prints — distribution without capitulation.
The open question a desk would ask is whether the slow-bleed configuration ends the way fast crashes do — with a washout that resets positioning — or persists as a grinding repricing. As of June 21, the market has shown the grind, not the washout.
What is the angle other coverage skipped?
The purchase-price breadcrumbs. Corporate treasuries publish their average execution prices, and those averages are free market data: April at 74,395 dollars, May at 80,985 dollars, each a verified print of where size actually changed hands. Read in sequence, they frame June's decline precisely — the market is below the spring's institutional accumulation zone — and they do it without a single chart-annotation debate. In a period when price-data disputes abound, the treasury ledger is the cleanest public record of where institutional flow cleared.
The second angle is the leverage footprint. Funding turned negative in both drawdown phases of 2026 — January and June — but from different starting points: January's leveraged crowd was long from the highs; June's had rebuilt during the May recovery. The same instrument, funding, is thus documenting two different generations of the same mistake.
What should readers watch?
Three prints, all public. Funding rates: sustained deep negatives mark forced-seller exhaustion, while early flips signal positioning reset. ETF flows: whether category redemptions accelerate into weakness as they did in January or exhaust quietly. And the corporate ledger: continued disclosed purchases through the drawdown would mark the third consecutive month of the market's only remaining large buyer operating below its own prior averages.
Drawdowns end; the honest version of this piece does not say when. What it can say is what June has established so far — a retraced recovery, unwound leverage, and a market waiting to find out whether the washout or the grind writes the ending.