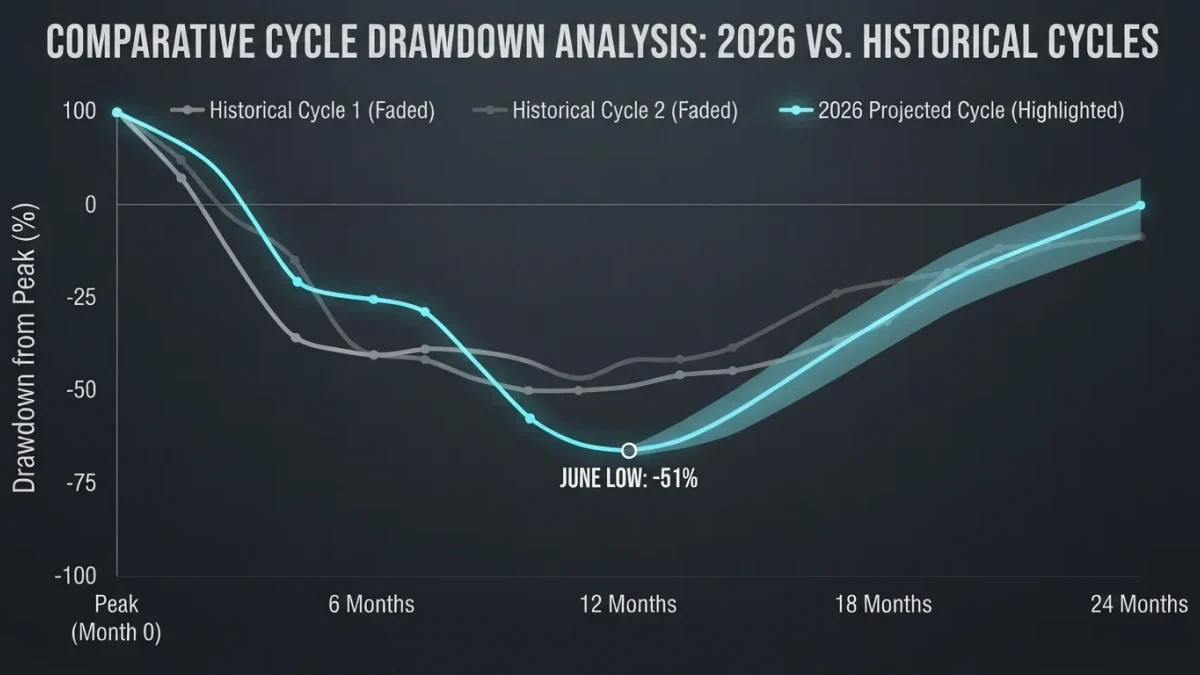
Bitcoin's July recovery lifted the price back to around 64,000 dollars after June's washout to lows in the 57,000-to-58,000-dollar range, with analysts at Investing.com arguing the June flush may have built a stronger accumulation zone. The drawdown from cycle highs ran near 50 percent — shallower than the 60-to-70-percent declines of previous cycles — though as of late July the price still traded below its 50-, 100- and 200-day moving averages, per IG's technical assessment of July 31.
Bitcoin Trader publishes information, not investment advice. Recoveries are descriptions, not forecasts; past cycles do not predict this one.
What did the washout and recovery look like?
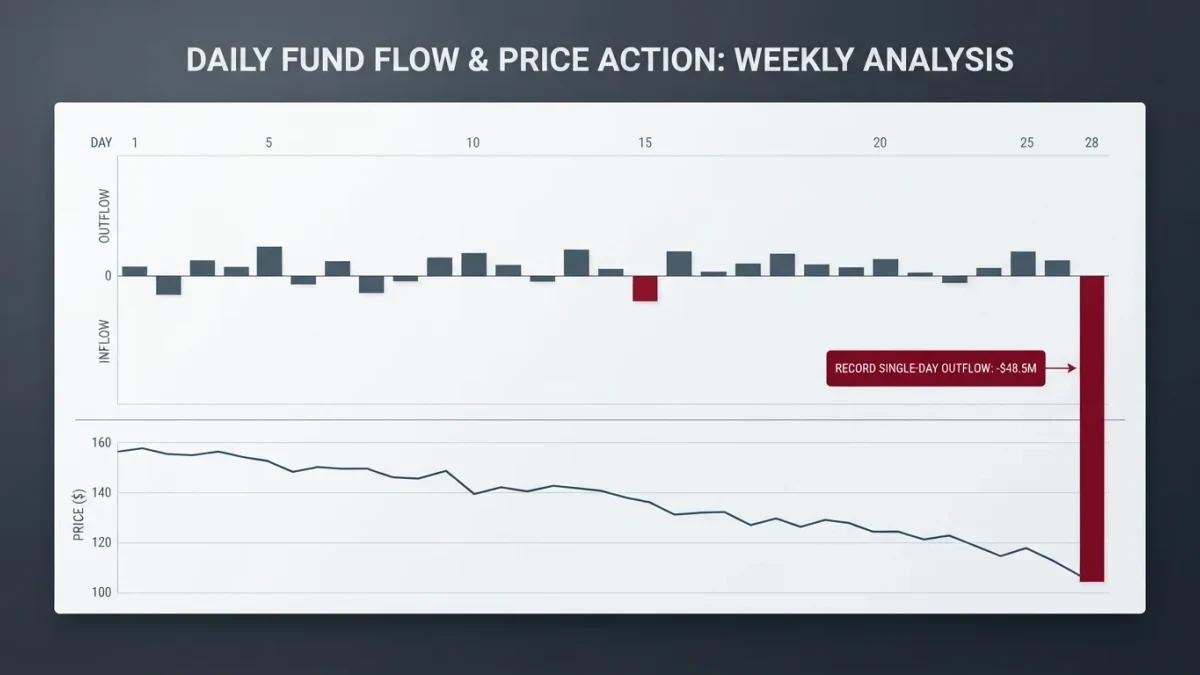
June delivered the capitulation the month's grind had been missing. From the mid-70,000s at the start of the decline, price swept to the high-50,000s — a roughly 50-percent drawdown from cycle highs — and ETF shareholders accelerated for the exits: June's category redemptions totaled 4.3 billion dollars, with IBIT absorbing 77 percent of the outflows by dint of its size, per Investing.com's flow analysis. Early July marked the turn: price reclaimed 64,000 dollars as the forced selling exhausted, and prediction markets that in June had seen little chance of a breakout began pricing a range instead.
July's character was repair rather than expansion. The recovery stall below moving averages — documented in IG's July 31 technical note — left the market in the awkward middle: above the washout lows, below trend, with the 60,000-to-64,000-dollar band doing the work of a base.
How does this cycle's math compare?
The headline comparison is the one the recovery thesis rests on: prior cycles drew down 60 to 70 percent from their highs; this one held near 50. The interpretation cuts both ways, honestly stated. A shallower drawdown can mean a structurally deeper holder base — ETF wrappers, corporate treasuries, market-makers with hedged inventory — absorbing what would once have been liquidation cascades. It can also mean the cycle's structure has changed in ways that make historical depth a poor yardstick, in either direction.
What is verifiable is the flow arithmetic underneath: the June washout removed 4.3 billion dollars of ETF exposure in one month and cleared the leveraged positioning that funding data showed rebuilt during May. The recovery began from a market with materially less embedded leverage — the observation behind the accumulation-zone argument.
What is the angle other coverage skipped?
The concentration of the outflow channel. IBIT absorbing 77 percent of June's redemptions is usually cited as a size statistic; read as market structure, it says the washout was funneled through one wrapper's shareholder base. The June low was, in effect, priced through a single fund's redemption queue — concentration that made the decline orderly in infrastructure and disorderly in flow, and concentration that will operate identically on the way back if inflows resume.
The second angle is the calendar's verdict on the year: January set IBIT's outflow record at a ten-month low, June nearly matched it at the washout, and July recovered without record inflows — the recovery so far has been built on selling exhaustion, not new demand. That distinction, more than any moving average, is what the second half of the year will test.
What should readers watch from here?
Three series, all public and daily. ETF category flows: whether the post-washout recovery starts printing sustained inflows — demand returning — or continues running on exhaustion alone. Funding and open interest: leverage rebuilt too fast would mark the recovery as fragile in the way May's was. And the corporate ledger: whether disclosed treasury buying continued through the lows — the one institutional channel that bought every drawdown of 2026 so far.
The washout did what washouts do — it found the floor by forcing everyone off it. Whether the floor becomes a base is the question August begins answering.